Episode 01 | Using Data Analytics in Outbreaks - Front and Center: The COVID EOC Podcast
Jun 1, 2020
Dr. Jason Moats and Dr. Ellie Graeden
Jason sits down with Dr. Ellie Graeden of Talus Analytics to discuss data analytics and how it can be used to guide efforts to mitigate the COVID-19 outbreak.
Resources:
IHME Models
COVID ACT Now Model
Imperial College Models
SEIR Model
COVID-local
Host and Guests:
Dr. Jason Moats
Dr. Ellie Graeden (@EllieGraeden)
More to explore:
About COVID-Local
COVID-Local.org is a central resource to aid local leaders in the decisions needed to address the community response to COVID-19. This site focuses on the Frontline Guide for Local Decision-makers, which provides a framework to help local leaders establish effective and immediate strategies to fight the outbreak. Learn more at www.covid-local.org.
Transcript of Episode 1 Follows
INTRODUCTION SPEAKER: Welcome to EOC Community Management (phonetic), the podcast designed to help local leaders understand and implement emergency operation centers as they respond to the spread of COVID-19 in their communities.
This podcast is brought to you through a collaborative effort between the Center for Global Development, The Texas A&M Engineering Extension Service, The Center for Global Health Science and Security at Georgetown University, The Nuclear Threat Initiative's Global Biological Policy Program and PDC Global.
And now, here's your host.
MR. MOATS: Good day. This is Jason Moats, Associate Division Director with the Emergency Services Training Institute at TEEX. It is truly my pleasure today to introduce our guest Dr. Ellie Graeden.
Dr. Graeden is the Founder and CEO of Talus Analytics, and an Adjunct and Affiliate at The Center for Global Health Science and Security at Georgetown University.
Talus Analytics is a small research and consulting firm that specializes in translating complex, computational and scientific analysis into useful data for decision makers. She earned a doctorate in biology from the Massachusetts Institute of Technology, where she held a National Science Foundation Graduate Research Fellowship, and she earned her Bachelor of Science in microbiology from Oregon State University.
Dr. Graeden was a 2013 Emerging Leader in Biosecurity Initiative Fellow with the Johns Hopkins Bloomberg School of Public Health Center for Health Security.
Ellie, welcome to the podcast. Glad to see you.
MS. GRAEDEN: Thank you so much for the invitation. It's my pleasure to be here.
MR. MOATS: So, we're writing the midst of this pandemic. It's—there's virtually no place in the country that's been untouched by this. And we're looking at how do we get from where we are now to—trying to regain some semblance of normalcy. I'm guessing that analytics really play a huge role in this. Can you talk to us a little bit about how we can use those and what they might tell us?
MS. GRAEDEN: Yes, absolutely. So, to start, you know, we've done a lot of work helping manage natural disaster response for a wide range of different types of natural disasters over the course of the last 5 or 10 years in the U.S. and we've been involved in some of those internationally as well.
Where, I think this particular pandemic has really taken people a bit by surprise and has been a real challenge for those at the state and local level is that we haven't in this country dealt with, large scale response for an outbreak in the recent history. And certainly in the lifetimes or in the careers of the people who are being asked to manage that response.
We've done a lot of work in the emergency management community to streamline and help make sure that those who are making the decisions for emergency management in the context of these events, understand what hurricane is understand how to take the outputs of a hurricane model and make the sorts of practical decisions based on that information that they're going to need to.
There's been a huge amount of work by the National Hurricane Center to communicate the outputs of their model in a way that's relevant. The Cone of Uncertainty, discussing what uncertainty means and how to make decisions in the face of that uncertainty.
The challenge with outbreaks is that we don't have that training. Those at the state and local level don't know how an epidemiological model works. We don't really understand how the data are collected, and where the uncertainty is going to lie in those data and that's a lot of what we're seeing right now.
I mean, we started getting case reports out of China in January, and into February. We are still trying to make sense of how to understand case reports and the uncertainty around them. The fact that we really only see case reports from those for whom we've had confirmatory testing. Well, that means that we're more limited by who's being tested, then we are maybe by who's sick. It may or may not be a good record for presentation.
Similarly, when we look at even the death tolls, we're seeing some larger—large variation in the numbers that are coming in. We think of those as being absolute numbers, but what we're learning is we don't do postmortem testing. That means that there are probably people dying. COVID-19 and of coronavirus infections that we don't know that they—that they're not getting classified as a case or classified as a COVID fatality. We're also finding that if people die at home as opposed to in a hospital, they aren't being counted in the official tallies.
So there's this basic level of uncertainty even around these numbers, which seem like they should be pretty sure. What we're also then doing is needing to collect those data at a global scale. And, again, that's another thing that we're not really used to thinking about.
A lot of the natural disasters we respond to typically are very localized. This is a global phenomenon. So as we collect those data, we're needing to pull all this in under CMS in context. And then to start do some—doing—start doing predictive modeling to understand what's going to happen next. So that's then the next sort of phase of this.
MR. MOATS: You mentioned predictive modeling, and I have a colleague here at Texas A&M, Dr. Gerry Parker, who likes to say, all models are wrong. And—but they tell us—they all tell us something. And so, I'm curious, if I'm sitting in my local EOC in say, Dubois County, Indiana, how do I know what model to use? Or how do I know how to use that model? What would you tell me sitting in there, looking at all these maps and everything else about how to learn to trust the data?
MS. GRAEDEN: Great question. So Gerry is right, all models are wrong, but they're directionally right, and I think that's the important thing. We can find out if the hurricane is going to hit the Atlantic side of Florida or the Gulf side. And that's the way to think about the epidemiological models too.
We can say, well, we know that this disease spreads really quickly. We know there are certain populations that it affects more than others. We can say with real certainty that we can only really right now change the number of people that we interact with, that's the benefit of social distancing. So we can use that information to model the spread, and get a sense for which levers we have control over and how much difference those levers are going to make in proportion to each other.
So the absolute math numbers, I think, matter less. I think the way to use epidemiological models is to say, "Okay, it looks like we're increasing in the number of cases pretty dramatically, and that's going to continue if we don't change something." If we pull this lever, if we turn on social distancing, then we can reduce that spread by say, 30 percent. What we're seeing in this country is that—in fact, we're getting reductions in mobility of 30 to 50 percent, we have a pretty solid estimate that that's going to correspond to a 30 to 50 percent reduction in contacts, which is then going to have a corollary effect on the rate of spread.
So we know that we can do that. And we know that we can then use that analysis to say, "Okay, well, that means we're going to get a 20 percent reduction in the total number of cases. So whether we were talking about 1,000 cases, or 10,000 cases, we can measure a 20 percent reduction, and we know it's going to be a big deal. We know that it will have impact, and we'll be impacting consistently in the right direction. I think that's the right way to be thinking about these models and the right way to be using them right now.
MR. MOATS: That's awesome. You know, it's always been a challenge for me working in an EOC to you know, not necessarily to use the information, sometimes to digest. But what really becomes a challenge is knowing where to go to get the information. Who do I talk to? I mean, these are really, really specialized bits of information. And so I know that that, for example, Talus deals in this, but are there other places, are there trustworthy sources to get this? And, if so, who are they?
MS. GRAEDEN: Great question. You know, this has typically been done the realm of the federal agencies who are experts in these fields. You know, we know exactly who the right agencies are for other types of hazards. We know to go to the National Hurricane Center, we know to go to the National Earthquake Integration Center, and USGS. We know to go to the U.S. Forest Service for wildfire. CDC and HHS really are the right place to be going from a federal perspective.
The challenge has been that CDC has been slow to put out modeling, and the models that they have been putting out haven't been with the user interface and made public. What we see consistently is that those models that are being used most broadly are those that are being communicated most effectively. And that's really consistent across a lot of different types of data and models, but it's been incredibly apparent in this particular outbreak.
So the two that we've been seeing used most frequently by state and local decision makers have been the model produced by the University of Washington, the IHME model, and the COVID Act Now model, which, in full disclosure, my team helps develop the SEIR model behind it. What we did was we helped make sure that the model they were using was based on the best modeling we were seeing coming out of the academic communities.
So it was building on Alison Hill's model from Harvard. It was incorporating elements and parameters that we were finding in the CHIME model from University of Pennsylvania. And from a lot of the modeling being done at Imperial College London, which has been really top notch. And Imperial College, among others, not to mention, Harvard and Penn have been leaders in epidemiological modeling for decades. They helped develop the fields, they've developed the methods. They are some of the world's best experts. All we did was draw on those methods—on the published methods and help make them a little more easily accessible. COVID Act Now did a nice job of building a user interface on top of it.
The model coming out of University of Washington, the IHME model, is very interestingly not a traditional epidemiological model. Their model is a curve fitting statistical model that worked really nicely early in the event. So some of these basic statistical methods are very effective, particularly when you aren't yet seeing complex dynamics associated with feedback loops.
So their model is based on the death counts that we're seeing in outbreaks as they unfold, and they take the curve—the shape of that curve, and they fit that curve and use that—shape of that curve to predict what the curve is going to be in other locations. So, again, where that worked nicely was early in the event when we had very, very little data and didn't have a good sense for what the spread was going to be.
What we're seeing now is that because that curve fitting exercise was based on data coming in of Wuhan in China, primarily at the beginning. It really overestimated the amount of social distancing we were going to be able to implement in other places and that's very much what we've been seeing. As they've been revising their methods and revising their data, we are seeing their estimates go up and they have across the board been far more optimistic in their estimates and in their predictions than the traditional epidemiological models.
What we're now seeing is that those epidemiological models and those—that traditional modeling—those traditional modeling methods are really where I think we should be focusing our effort now. That's where we're seeing the most consistency in the results. And when we—the best way to think about this is actually very akin to the hurricane analogy here. What we use is what's called an ensemble of models. We use a range of different methods and a range of different models with a range of different assumptions to get a full description of what we think the possible outcomes could be, and then we under—then that helps us understand what the average or the more most likely sort of middle scenarios are going to be. That's what we're doing with the SEIR models now as well.
What I would recommend is, take a look at 2, 3, 4 different models and see where they're all pointing in the same direction. That direction is likely to be right. And again, as I mentioned earlier, it's about directionality and about what you can do about it, more than it is about the exact numbers.
MR. MOATS: That's really helpful. Really helpful. You know, you mentioned this a couple times, and I'd like for you to explain this a little bit more. You talk about the SEIR model. Now, I think I know what that means. But what is that model and can you explain a little bit about how it works?
MS. GRAEDEN: Yes, absolutely. And this is one of these hazards of being a modeler in a field, that isn't familiar to everyone else. So, an SEIR model actually refers to the different compartments that we move through over the course of the disease. So it's—they are literally referred to as a compartmental model.
You start at susceptible, that's your "S". From your susceptible population—and this applies both at the individual level, but also at a population scale. So you put all the people who are susceptible into one big bin, that's our—for coronavirus, and for COVID-19, that's everyone. None of us had seen it before. None of us were immune to it. You can imagine that for a disease like measles where a lot of us have had a vaccine. That proportion of the population is a lot smaller. So you start out as susceptible.
You then get exposed to the virus. That moves you into the "E" compartment. Once you're exposed, only a certain percentage of us actually become infected. So when you move from exposed to infected, you can incorporate that percentage in your calculations. We move from "S" - susceptible to "E" - exposed.
From exposed to infected or "I"—SEI. From your infected population you then can become recovered. Move into the recovered event. That's the sort of simplest form of an SEIR model. The math then incorporates the likelihood that you will become exposed. That's based on primarily on contact rate.
We can then measure and calculate the likelihood that you'll become infected. And once you become infected, we can then run some calculations on what type of infection you'll have. Is that going to be severe? Are you going to be hospitalized? Are you going to become hospitalized and requiring critical care as in an ICU? Are you going to need a ventilator once you're there? So those are all additional elements around that infected compartment that we can add additional specificity.
From there, you then can move into recovery, you can also move into a fatality bin or a deaths bin. So that's then the more complex version of this. But in each one of those steps, that allows us to apply a calculation and a mathematic calculation to the rate that you move from one bin to the next. So how quickly you do that, but also what percentage of the population moves through that—those bins.
What that allows us to do, and one of the real benefits of that particular type of modeling is it allows us to incorporate all of the different data that we have. By incorporating all of those different data, as we were talking about earlier, there's a lot of uncertainty around each one of them. If what You're doing is a statistical model that's solely based on deaths, you are very limited to the types of error that we have around deaths. There's no ability to sort of flesh that out or to create less uncertainty around that one element. You're stuck with what you've got.
When we look at an SEIR model, and you're talking about cases and deaths, and contact rates, and all of these other elements, that uncertainty starts to balance each other out a little bit and we can start to put a little bit more weight where we have more or less certainty, right, so we can wait it a little bit differently based on where we are most certain now. So we end up with a much more nuanced model that allows us to look at a broader range of scenarios, and incorporate a broader understanding for how the whole system works. And that's where it gets really important when we're later in an event and we're looking at a really complex event across a whole population.
MR. MOATS: You know, I like where you talked about—also, you talked about the ensemble of models. Although, in my background, I'm a hazmat responder. So you know, going out to overturn semis and stuff like that. And, and we never really relied on a single source, because everybody has their own perspective, their own agenda and things like that. So we would do trying to get triangulation and that seems like what you're talking about here with the ensemble model.
MS. GRAEDEN: That's exactly right. And any way we use to measure these different values, just like you did in the chemical exposures and radiological exposures, every one of those instruments has a different type of error, but that error can help balance each other out.
MR. MOATS: So one of the things that has been problematic, and you talked about it in terms of uncertainty. But I think that if we can draw this out a little bit and talk a little More about it. Are those populations within society, within a community that we really don't know about? So, for example, we heard a lot in Los Angeles about the homeless community. But we look around the country, we know that we have these homeless communities that are generally unseen by the public. How do these models incorporate the uncertainty created by these kinds of populations?
MS. GRAEDEN: It's a great question. So there are two different answers to that. One is that, categorically speaking right now, they typically don't. And the second part of that question—that answer is that they can. I think there's a third question, which is about whether they should. So in the first case when we're thinking about why they don't already, it's because we needed to get some basic models that got us in the general ballpark, and then help us understand what the big muscle movements needed to be.
The reality is when we, when we implement something like social distancing, and we see a significant change in mobility, we're talking about broad scale changes that have a 30 percent to 50 percent impact. When we start talking about modeling subsections of the population, and this is certainly true for groups like homeless populations or prison populations, where what we're seeing is fundamental differences in how people interact, who they're interacting with, the frequency of those interactions, and interactions with other segments of the population.
The question is whether those differences are going to be large enough or generate a large enough difference to change the message for what we need to do. If it's going to only make a 1 percent to 2 percent difference, that's going to be masked in the rest of the error, we're not actually—it's not going to change the message on whether social distancing, its useful or not at a society level scale. Where it does get really useful is in thinking about how we help protect those vulnerable populations, how we make sure that they are—that those populations are more at risk than others, and how we help manage that that situation so that they get the care they need, and that we're helping protect those vulnerable populations.
The other aspect here is that we can also use that same sort of thinking to look at populations that are particularly at risk for the disease, elderly, those with comorbidities, meaning those who have other illnesses that are going to amplify or increase the likelihood of very severe version of the disease. So we can also be thinking about using that same sort of sub-sectoring of the population in our modeling to help us understand how to protect those who would be more severe or require more care within a hospital condition.
So it's the same sort of methods that would be applied there and we certainly are seeing some of those models being applied to prison populations or being used to really refine within a given hospital system, what their care requirements are going to be and how that's going to be different in, say, rural Louisiana than it is in urban Manhattan.
MR. MOATS: Again, that's really helpful and kind of helps me wrap my mind around, when we talk about in the emergency management community about the social vulnerabilities and those that fall into that, you know, how we account for those in in the models? So, I think it's important to note that today is April the 22nd of 2020, because at some point, we're going to reflect back on this and go oh, "Well, that's where we were and this is what we said about the future."
There's a lot of lessons that we observe. Again, Gerry Parker is famous for saying, that lessons learned is a misnomer quite often because learning indicates some change in behavior. So many times what we call lessons learned are actually lessons observed. And we know that there are going to be a huge number of these now coming out of this COVID-19 pandemic.
My question for you is, as we look to the future, as we look for the preparation for the next great pandemic, what lessons are you pulling out, are you taking in that we should really act on and get ready for that next big one?
MS. GRAEDEN: Yeah, absolutely. So I think there are a couple of big things that we're trying to do to make sure that what we're learning now can be applied for the future, that we're capturing what we're doing now, capturing it as written guidance, so that it can go into next year's pandemic preparedness plans.
So, in that list, one of the big efforts that we've been doing as part of COVIDlocal.org. This is in collaboration with the Nuclear Threat Initiative and Center for Global Development, in addition to the Center for Global Health Science and Security at Georgetown, has been to integrate all of the preparedness plans and guidance that was available globally for how you stand up in emergency operations center, how you manage and operate a response in the context of a large scale outbreak and applying that to a U.S. Emergency Management frameworks.
So in that context, we've developed a series of written guidance and questions that help state and locals walk through a process and figure out how they implement it what needs to be implemented? What questions do they need to be asking? What do they need to make sure it's in place? That sort of guidance and the operationalization of that guidance, I think is going to be really important and is a huge new step forward in what we're going to be able to use and apply for future preparedness efforts, and will really put us in much better sense for how we respond to both smaller scale outbreaks in the future, but any additional large scale outbreaks that we see.
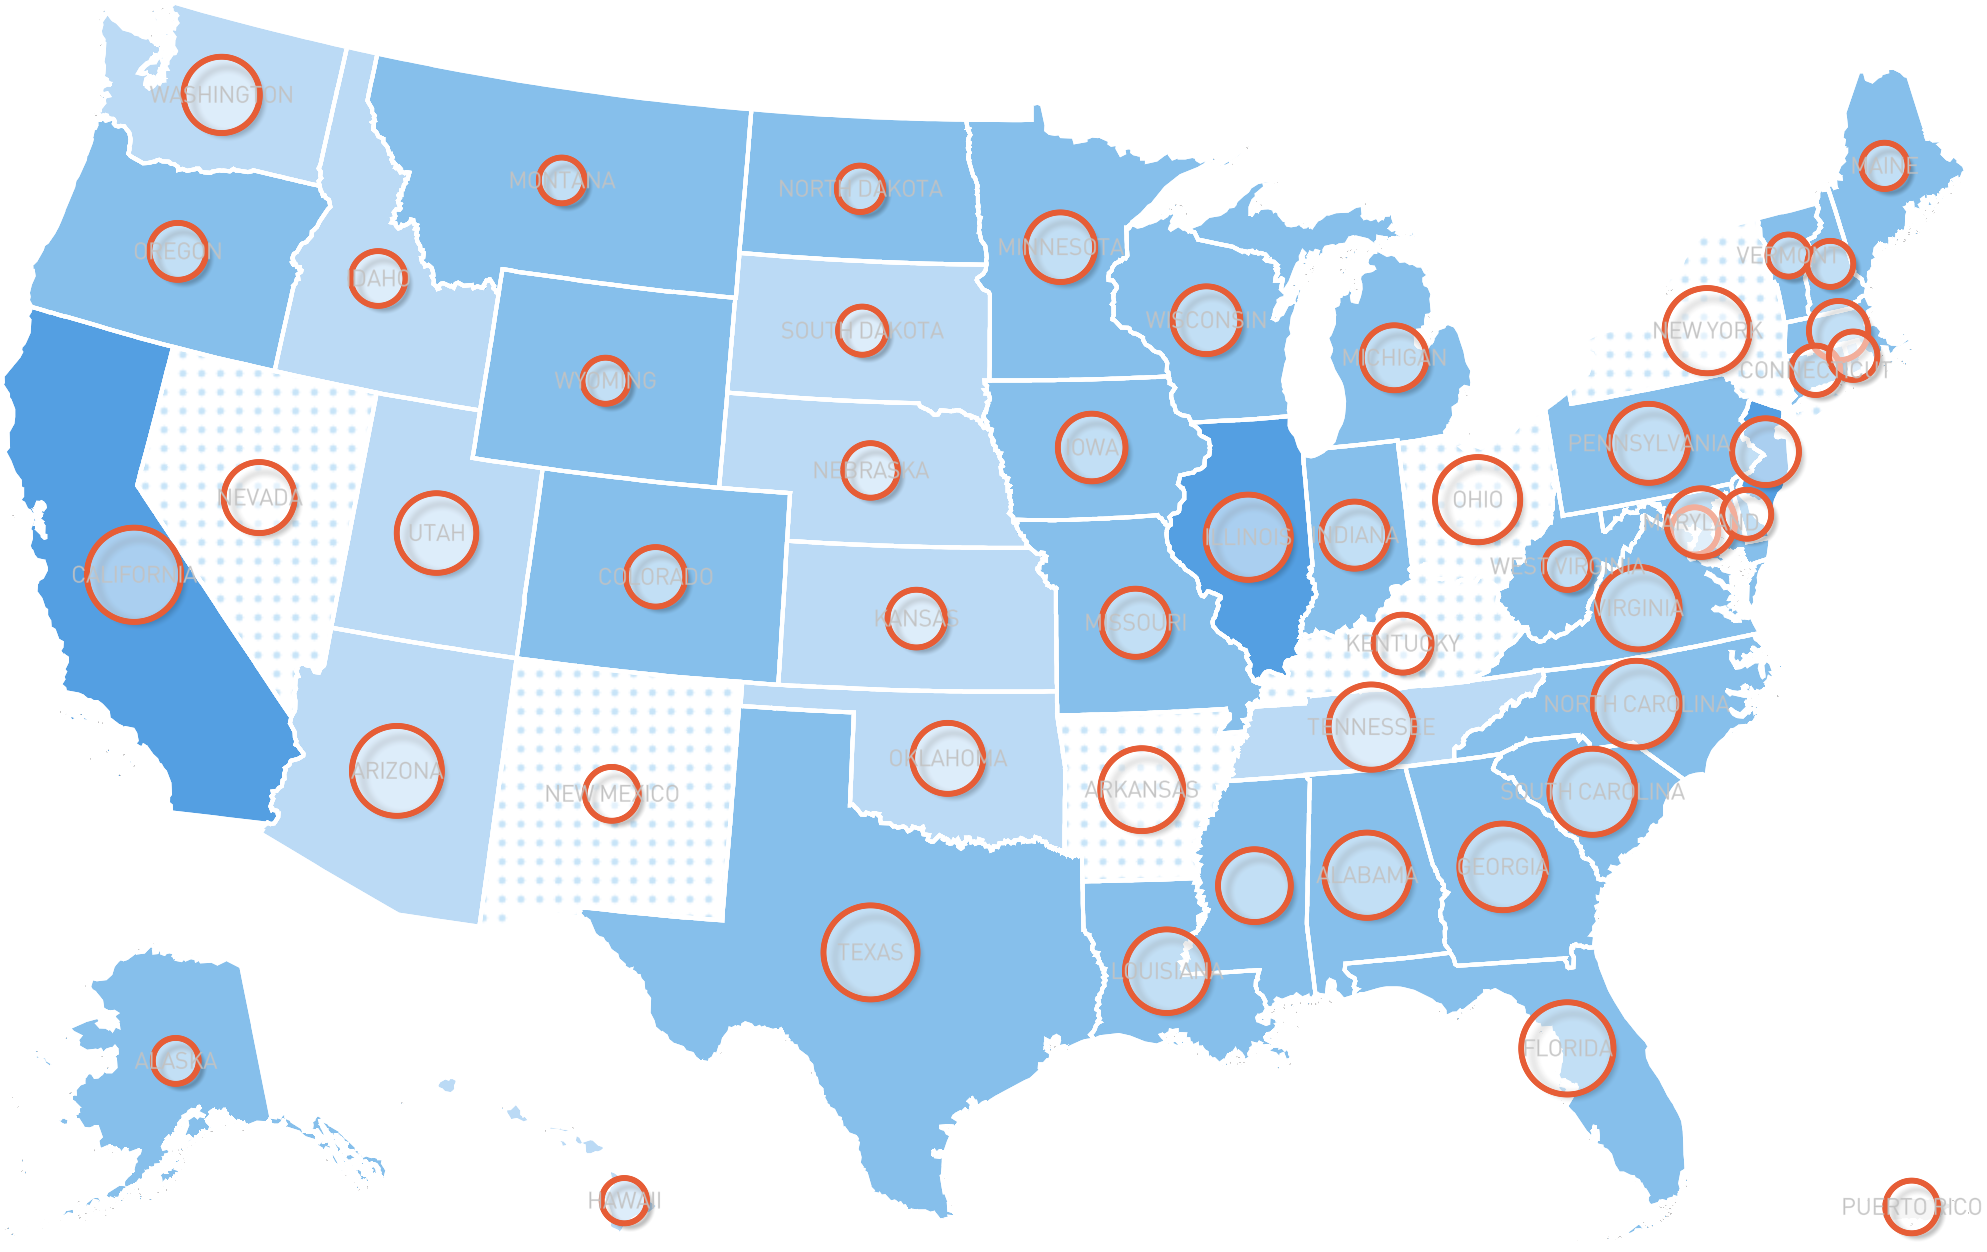
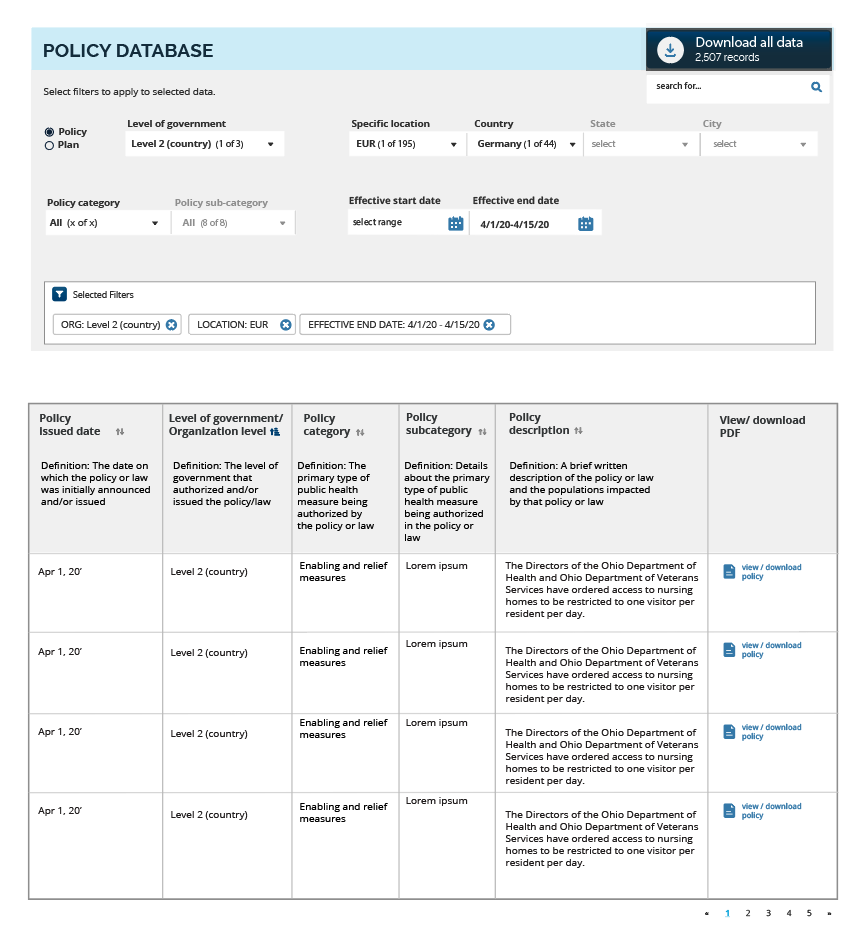
The second place that we're putting a lot of effort is in collecting the evidence base. We actually have no data, or very, very little data currently on which of these social distancing measures work where, when, for whom, and so we're collecting those data. And one of the things that we're doing is we're working with the legal team at Georgetown to collect all of the policies that are being implemented at the country, state and local levels.
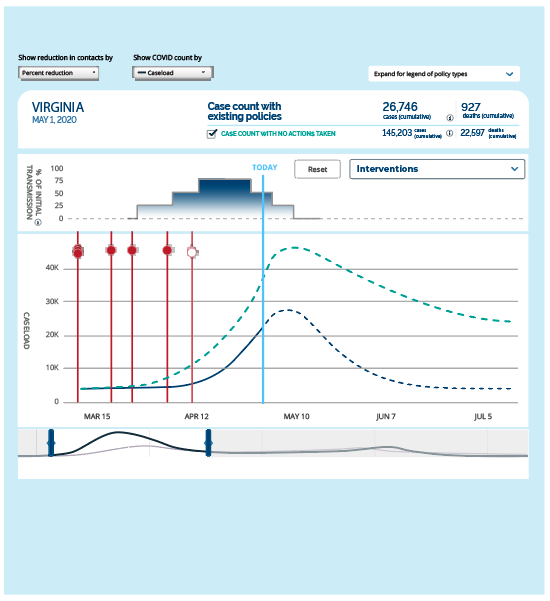
We then are using a huge number of data analysis methods around public health surveillance data and then predictive modeling, like we've been talking about and we're integrating all of those so that we can align when those policies were implemented, relative to where that location was in their outbreak, and who was affected and to what degrees. And what we then see happen with that outbreak in the next month, 2 months, 3 months?
What that's going to allow us to do is perform longitudinal analysis on which policies were implemented, when and where, and what impact those policies had on the outbreak. Which ones worked, which ones really didn't? How was that different in urban areas than rural areas? Did we see different dynamics for which policies worked? And we're collecting those data in real time and the real power here is that as we do that, one, we're able to incorporate that data into our modeling and it's refining and improving the predictive analysis that we're using now to figure out what we should be deciding and what should we—what we should be recommending for the actions that we take this month and next month.
It's also going to have a huge impact on how we respond to what we anticipate will be a second wave of disease. If we start lifting these social distancing measures now, we are very likely to see a significant uptick in the number of cases. So what we know for sure, so far, is that social distancing has worked. It's worked really well. We've seen a really dramatic decrease in the rate of spread nationally.
And that's due to the national efforts that we've implemented where even in those places where they didn't already have a lot of cases, the fact that they're not moving around, means that they're not getting that disease from those areas where there is significant disease load currently. Once we release those measures that spread is going to pick back up and we're going to start seeing those cases again.
As we see those cases, again, we're now going to be able to reflect on the data we're collecting about the policies and what worked in the first wave and apply that to the second way. And that's going to be really, really powerful and I think that's where I start to think about how we can be using this information and this data, not only in our real time decision making, but again for that future—hat future self so this becomes not just lessons observed, but lessons from which we can learn and be applying at even within this outbreak.
MR. MOATS: That's really important. This is daunting. We've never seen this disease before and, let's say, at the earliest, maybe mid-November, and it has spread in ways. And rightfully so, we nationally in the U.S. have taken these dramatic steps and people are getting little restless, we know and things like that. But having that data where we can go back and reflect and we can show how important this was, I think really bolsters what we do in terms of emergency management and public health.
And, again, epidemiology and public health and emergency management are—they're not individual sports, they're team sports. And it takes us all coming together to work on this. So, Ellie, our time is just about done here. Is there any parting thoughts that you have that you'd like to share?
MS. GRAEDEN: I think maybe just reiterating the importance of the actions we can take. There's a lot of uncertainty right now, but we know what does work. And we know that actually right now we have a very limited number of things that we can do. We can stay home. We can, as cooped up as we are and as much as our children are climbing the walls, it's helping, it's making a huge difference. And the fact that we are seeing a significant reduction of cases and that we're only seeing a few really extreme hotspots where we have challenges around hospital capacity.
What I think we really need to be underscoring is that the social distancing work that we've done so far has dramatically increased our ability to provide care for those who need it. It has worked. It is working. And we need to remember that that's a huge success and building on that success is going to be critical. And as you're describing it, it's a team effort to make sure that we can do that and to find a way that we can do that, while acknowledging that we also need to have an economy that's functioning. So there's a sweet spot in there and the more than we can all do, the more that we're all helping contribute toward a positive outcome.
MR. MOATS: Well, Ellie, thank you for your time and sitting down and talking about this really important issue and providing some help and advice and the wisdom to our EOC folks, our emergency management folks. Really appreciate it, and looking forward to talking to you in the future.
MS. GRAEDEN: Likewise. Yes, thank you so much for the invitation. It was my pleasure.
MR. MOATS: Our guest today is Dr. Ellie Graeden, the founder and CEO of Talus Analytics. Thanks for tuning in and we'll be back soon.
SPEAKER: Thank you for tuning in to our podcast. This podcast series is brought to you through a collaborative effort between the Center for Global Development, the Texas A&M Engineering Extension Service, The Center for Global Health Science and Security at Georgetown University, The Nuclear Threat Initiative's Global Biological Policy and Program and PDC Global.
Thank you and stay safe.
LIST OF PARTICIPANTS:
JASON B. MOATS
Associate Division Director
Emergency Services Training Institute
ELLIE GRAEDEN
Founder CEO
Talus Analytics